01

Building a research function from zero

Leadership · Research opsEstée Lauder Companies · 2017–2025
UX ResearchExperience StrategyProduct & Design LeadershipAI & Insight Systems
The problem

The Estée Lauder Companies had 19 global beauty brands making digital experience decisions without a shared research practice. Insight was commissioned ad hoc, methods varied by brand, and findings did not travel between teams.

My role

I built the UX research and insights function from the ground up and led it for eight years, growing it from a single practitioner to a twelve-person team across two management layers.

What that required
  • Foundational methodologies, processes, and team structure where none existed
  • Hiring and developing managers, not only researchers
  • Operating across in-house New York, remote US, Romania, and South America
  • Earning standing with brand, product, engineering, and marketing leadership
Team at peak
1

UX design manager

1

Senior UX research manager

1

UX research manager

3

Senior UX researchers

6

UX designers

Many carrying research alongside design

Two management layers reporting into me, distributed across four geographies.
/ What I built
01 / Research function

Six documents, written in the
order the team needed them

A research function is not a headcount. It is the set of documents that let everyone else work without you in the room. These are the ones that made the practice legible, in the order the gap appeared.

Global UX principles
Team vision and goals, a request path, and a cadence table naming four standing meetings with their owner, attendees, timing, and purpose. Coverage was assigned by product area rather than by brand, so every surface had a named researcher.
2018 · Charter
Can you say that in English?
A UX concepts series written for the people who approve the work. The information architecture session taught ontology, taxonomy, and choreography through a theme park, then landed the same three ideas on a fragrance.
2018 · Literacy
Global UX guidelines
Overlay standards where every rule carried its evidence: published survey data on the ad formats users disliked most, live tests on overlay variant and trigger timing, search engine policy on interstitials, and the keyboard focus a modal owes a screen reader user.
2019 · Standards
Global UX metrics and KPIs
Separated what users do from what users say, named the instrument for each, and defined a single experience score per feature. Carried an eleven-step pre and post launch workflow and a twelve-row table assigning every evaluation task to an owner.
2019 · Measurement
Research and analysis process
Four research phases, twelve packages with a stated vendor and a published turnaround, intake through the ticketing system, and one documented home for every result.
2021 · Methods
Data synthesis plan of action
Four sharing principles, a mapped landscape of every quantitative and qualitative source in the company, standing release channels, and a per-role charter covering what to do before opening a study and what to do when the answer contradicted the last one.
2022 · Governance
/ What I built
01 / Research function

A documented method library,
not a person you have to ask

Any team could choose the right method, understand what it would produce, and see what it would cost, without commissioning a researcher to decide that first.
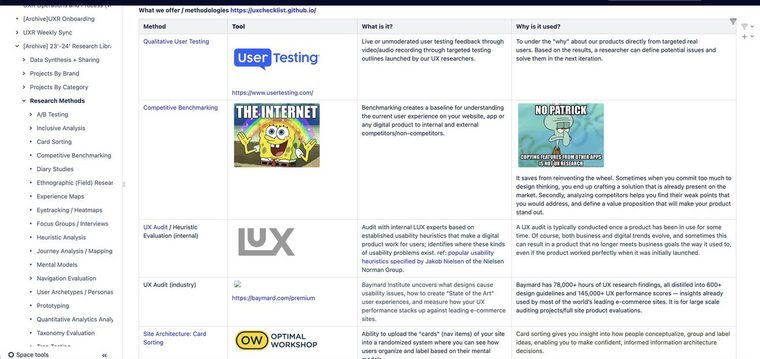
Research Methods taxonomy page
The central taxonomy page. Generative, descriptive, evaluative, and causal research defined, then a method-by-method reference covering tool, purpose, and when to use it.
Standardized research packages
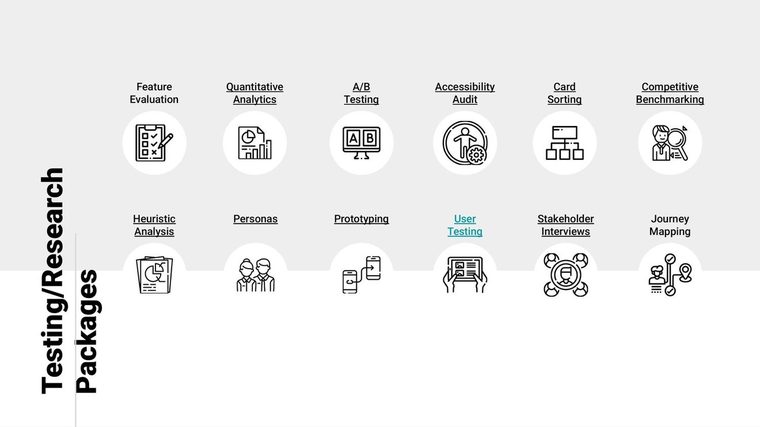
Twelve standardized research packages, each with a defined outline, deliverable, vendor, and turnaround time.
/ What I built
01 / Research function

Every package with a turnaround
a product owner could plan around

Requests arrived as open questions and were answered as bespoke projects, so scope was renegotiated every time. Naming the packages, and committing to a turnaround for each, turned research from a favor into a service.

Feature evaluation Quantitative analytics A/B testing Accessibility audit Card sorting Competitive benchmarking Heuristic analysis Personas Prototyping User testing Stakeholder interviews Journey mapping
Published turnarounds
User testing
Five to seven participants, a test outline, an evaluation chart of findings, a desktop and mobile breakdown, issues ranked catastrophic through cosmetic, and a recommendation per issue
10–15 days
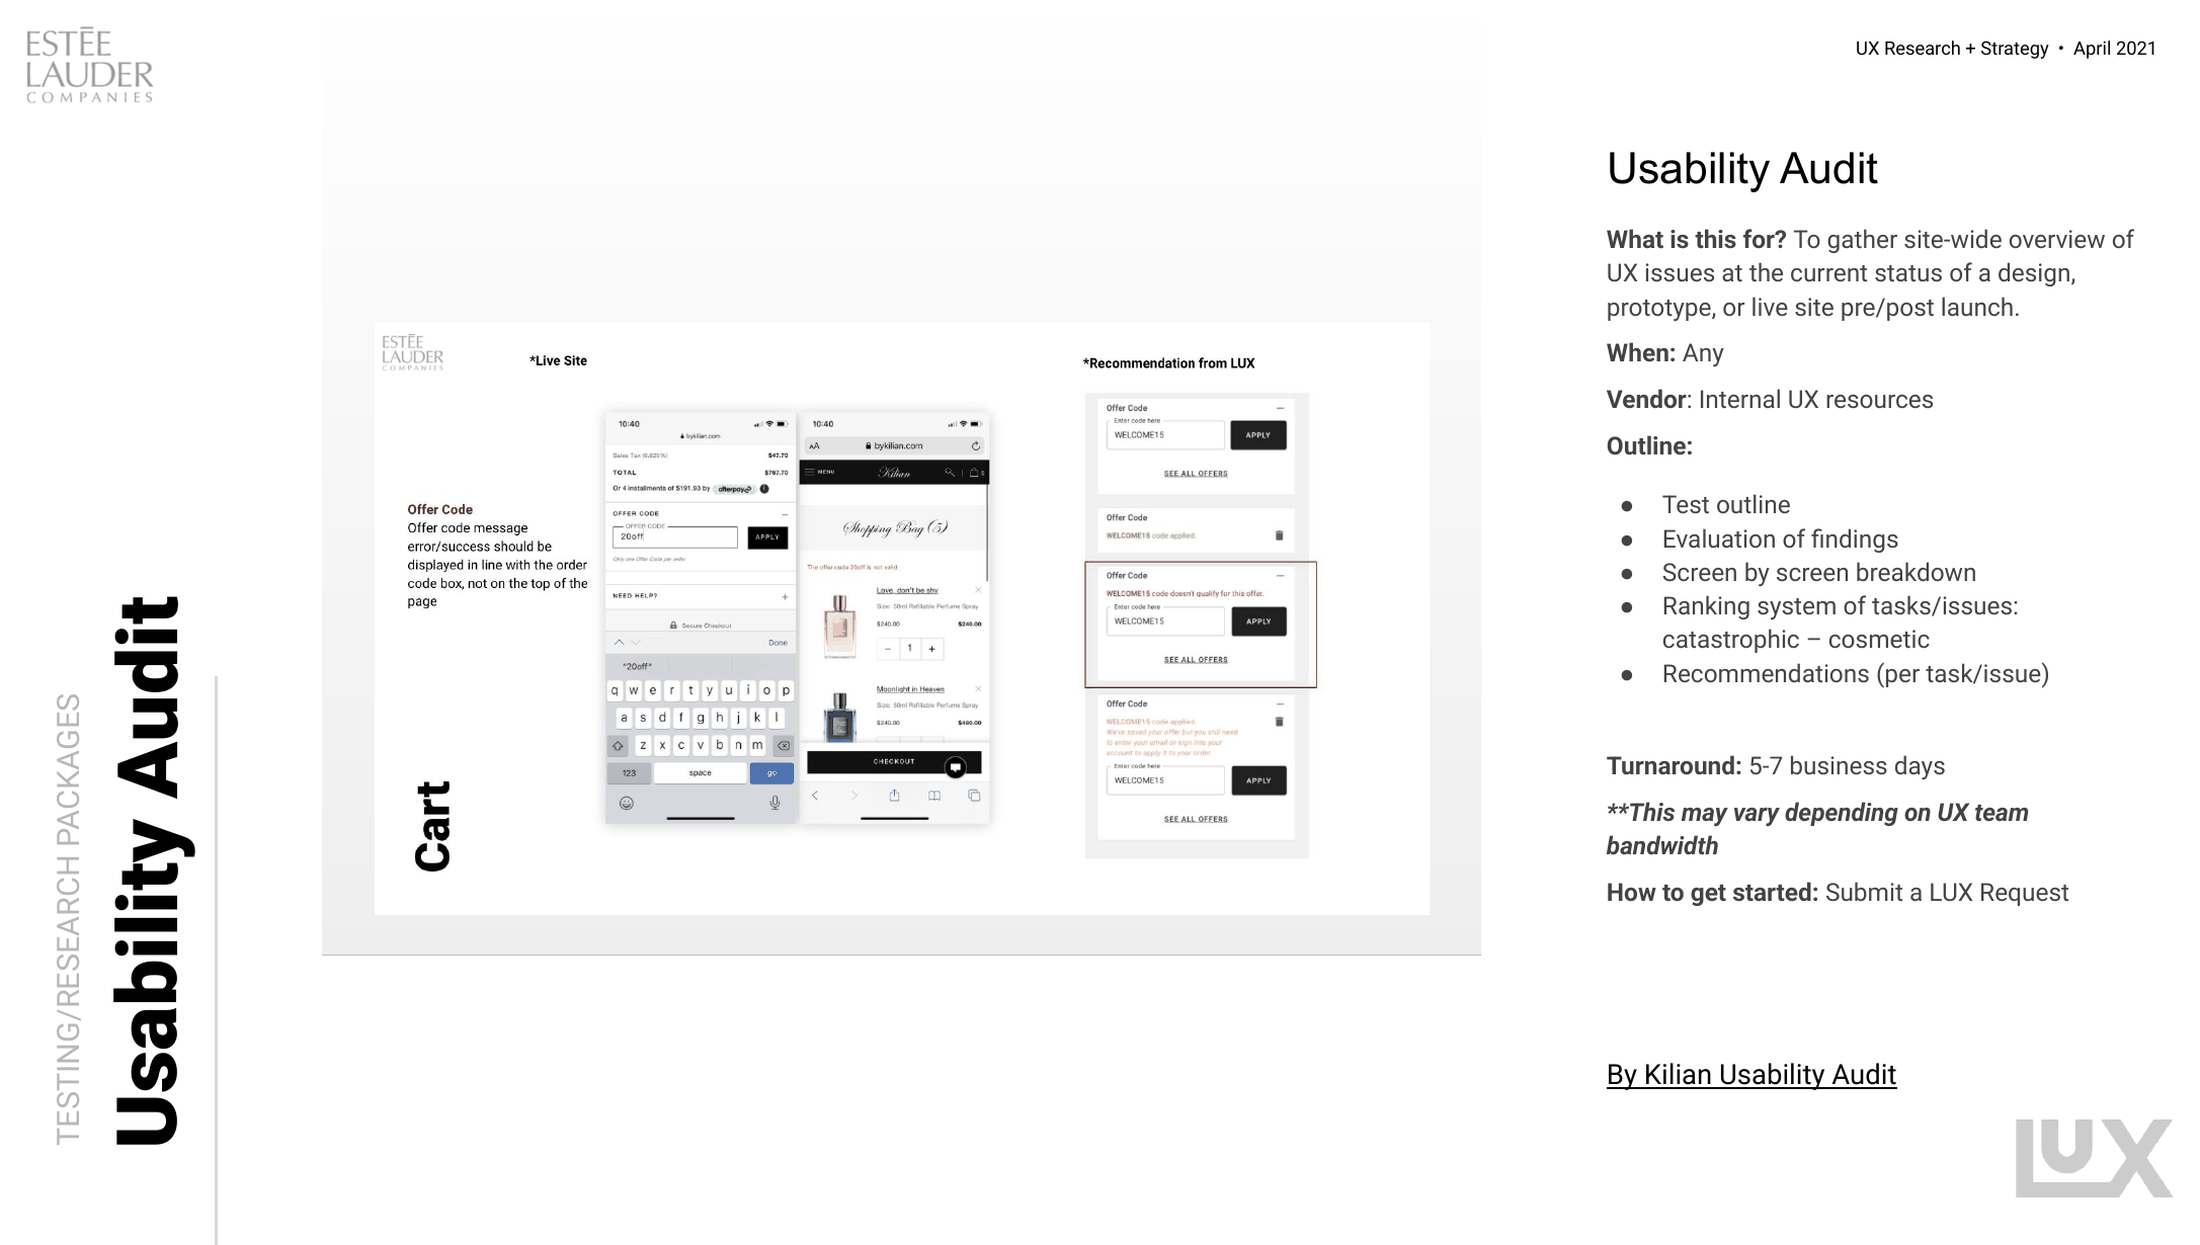
Usability audit
Site-wide review of a design, prototype, or live site, screen by screen, on the same catastrophic to cosmetic ranking
5–7 days
Stakeholder interviews
Up to six stakeholders per group, an hour minimum, findings circulated, then a working session converting them into owned items
5–7 days
Prototyping
A testable prototype of the features in question, run with a curated list matching the audience, then revised for handover
5–7 days

Every turnaround shipped with the same caveat attached: may vary depending on team bandwidth. Publishing the number and the caveat together was the point. It gave partners something to plan against without pretending capacity was infinite.
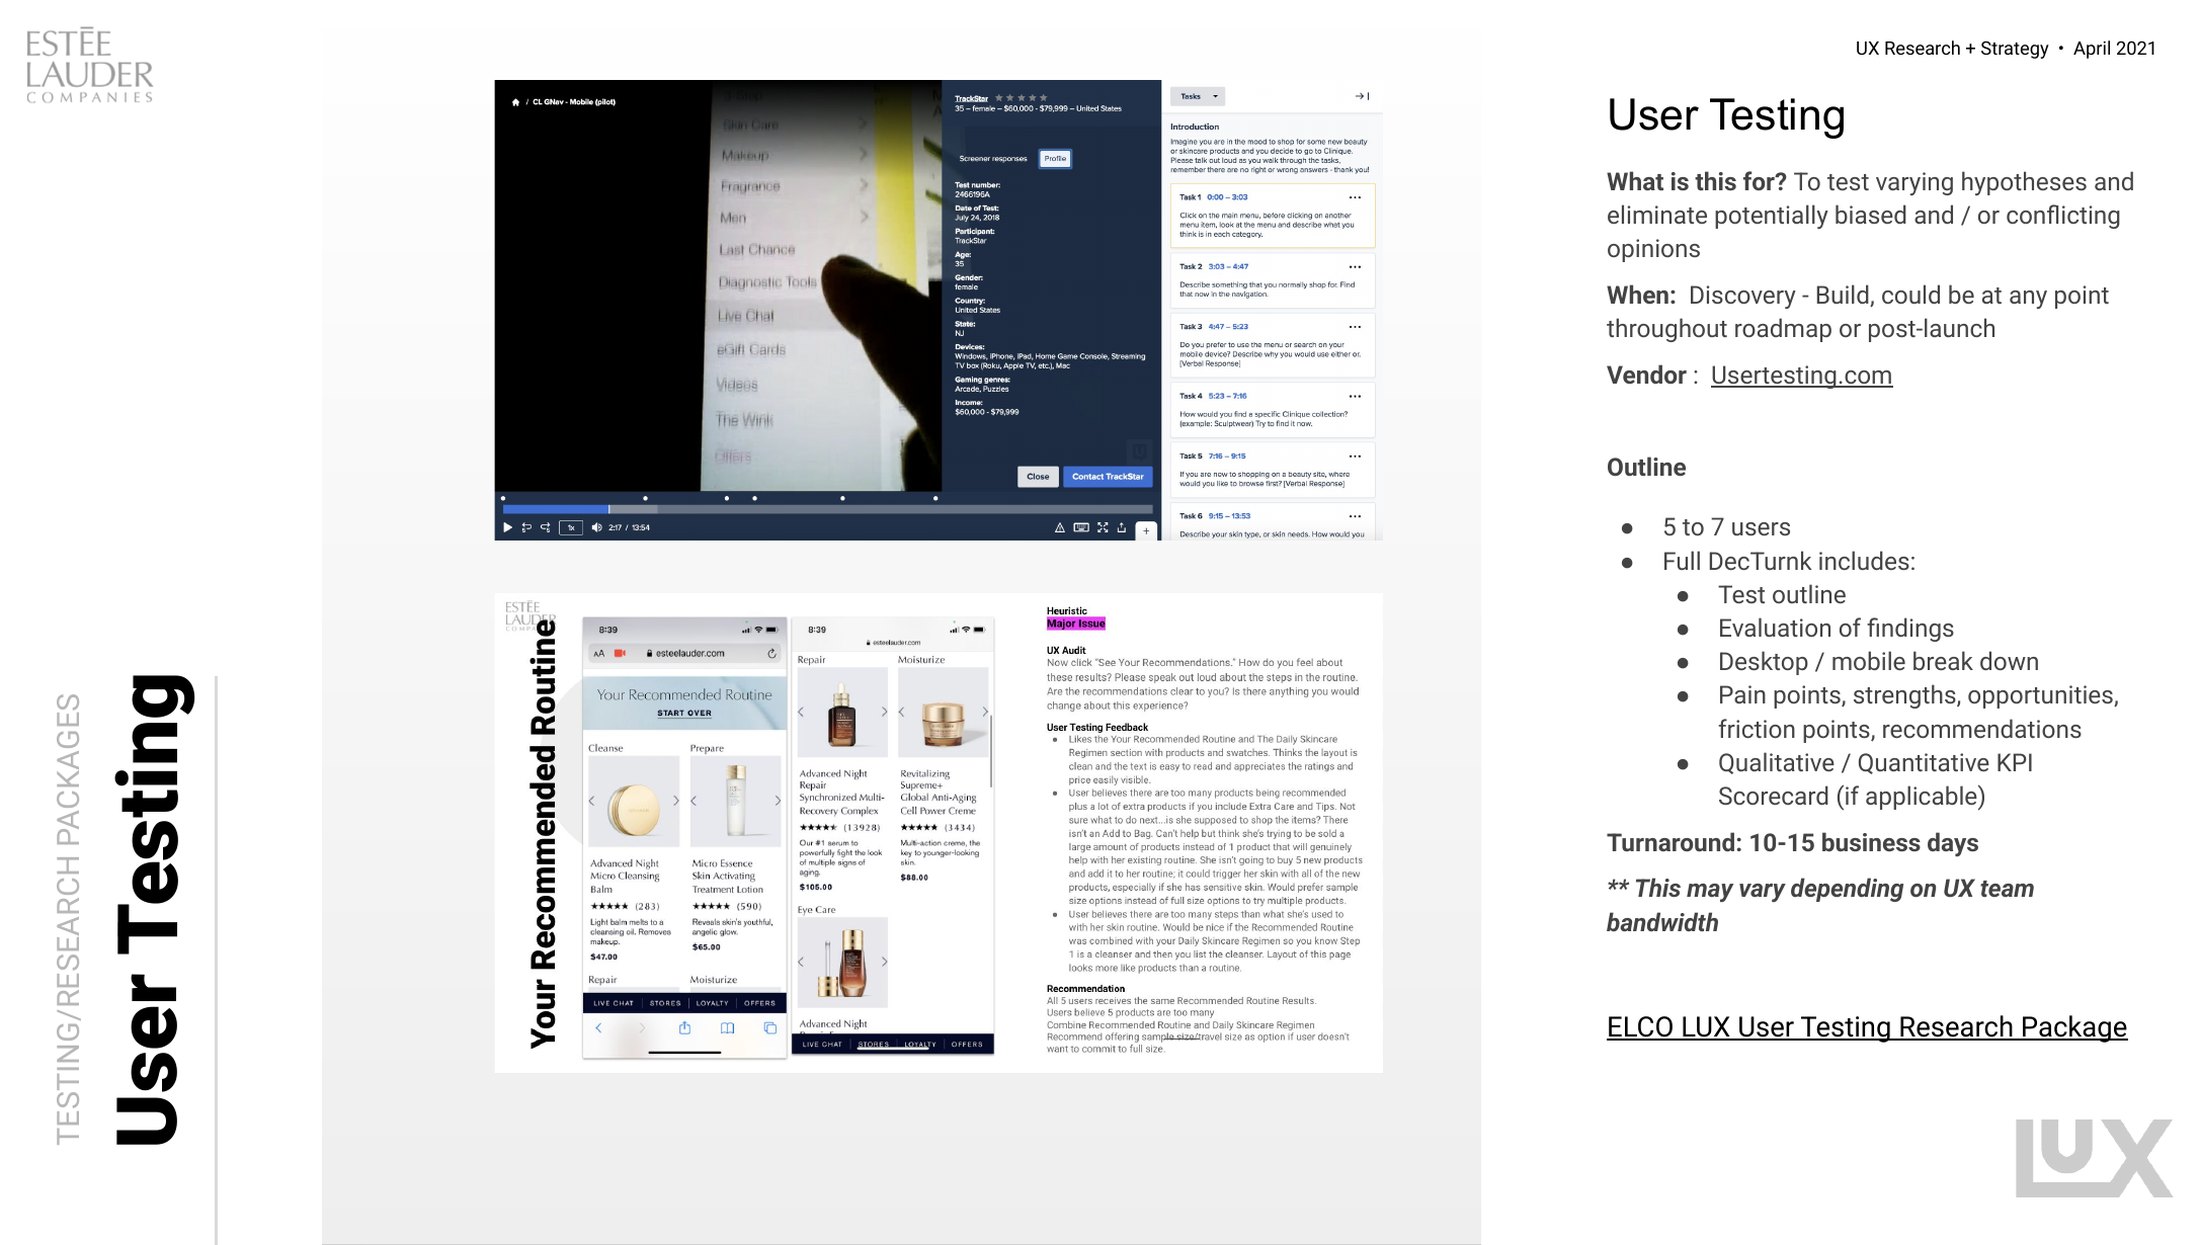
The user testing package specification
The user testing package as published: five to seven participants, everything the deliverable contains, and ten to fifteen business days with the bandwidth caveat printed underneath.
The usability audit package specification
The usability audit package. Run on internal resource at any point in the cycle, screen by screen, five to seven business days, and one route to start it.
/ The mechanism
01 / Research function

Turning a session into a number

Brands could not weigh a usability finding against an analytics figure, so qualitative work lost every prioritization argument it entered. The scorecard gave a feature one score built from both halves, and made pre and post launch comparable.
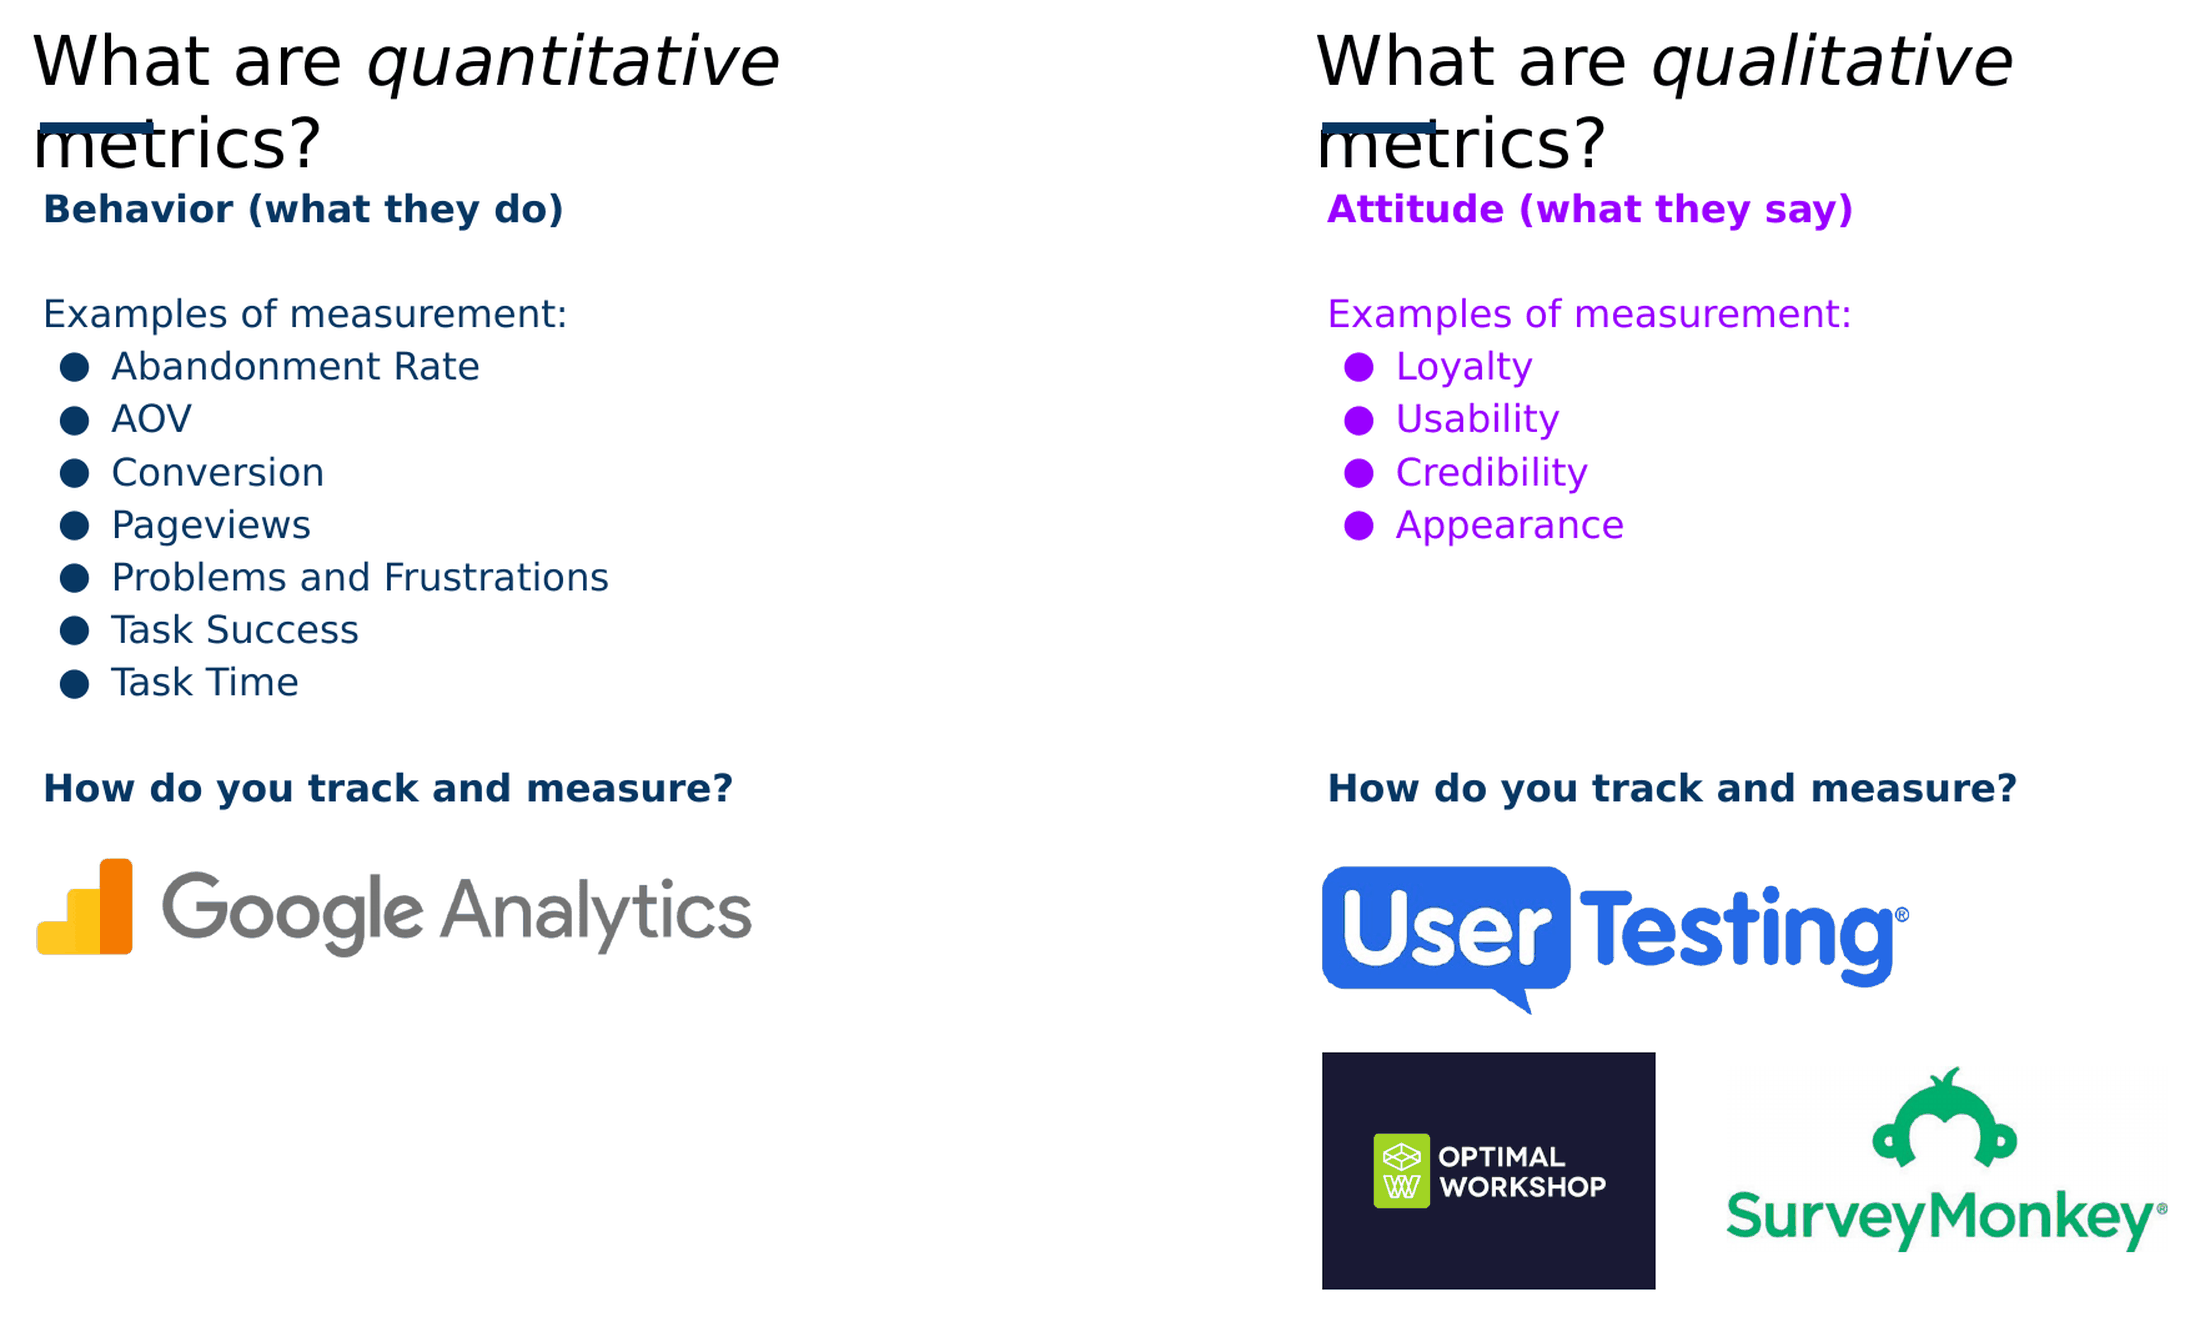
Quantitative and qualitative metrics defined side by side
The split the score was built on. What users do on one side, what users say on the other, each with the measurements that carry it.
Behavioral input · Task success
The share of participants completing each task, scored task by task rather than as one pass or fail on the session.
Attitudinal input · Attitudes
System Usability Scale and Net Promoter Score run at the end of the session, plus four dimensions scored against the feature itself.
Very poor
<45
Poor
45–75
Good
76–90
Great
91–100
Scored per task
  • Find the category page
  • Browse shades within it
  • Find the shade finder tool
  • Complete the shade finder
  • Reach a product page
  • Add the product to bag
Scored per feature
  • Usability
  • Trust
  • Appearance
  • Credibility

Metrics were chosen against the journey rather than applied uniformly. A macro journey earned abandonment, pageviews, and conversion; a micro journey inside a single product page earned task time, appearance, and credibility. The same set ran again after launch, which is what made the comparison mean anything.

/ What I built
01 / Research function

Intake that scales, and tooling
people can actually use

One request path into the team, and a documented enablement layer so behavioral analysis was not gated on a single person's calendar.
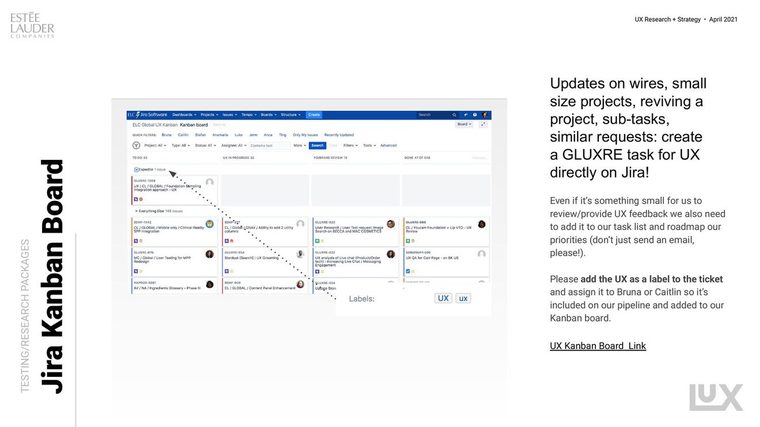
UX Kanban intake board
A single intake route. Every request, however small, became a labeled ticket on the Kanban board rather than an email, so priorities stayed visible and could be roadmapped.
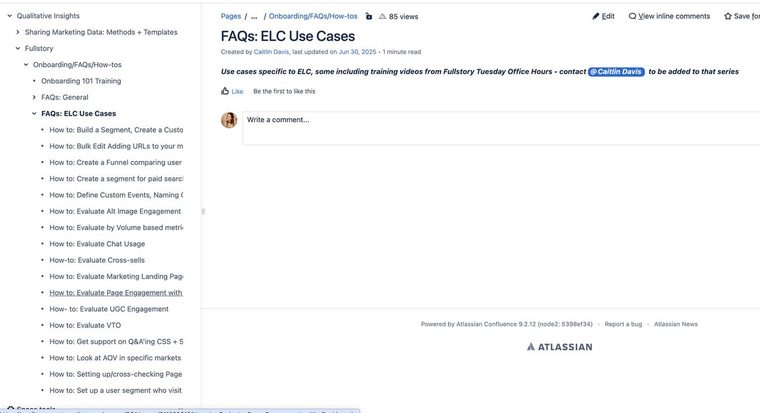
Fullstory use case library
An ELC-specific Fullstory use-case library and a running office-hours series, so brand and product teams could answer their own behavioral questions.
/ How it ran
01 / Research function

One path in,
one place it lands

Work that arrives by email cannot be prioritized, staffed, or counted. Every request took the same route, including the small ones, which is how the function got a pipeline instead of a queue of favors.

The Kanban board above is the visible end of this. The rules are what kept it accurate.

01

Request opens a ticket

No exception for a quick review or a verbal ask.

02

The ticket carries what triage needs

A UX label, a budget code, defined requirements, links to prior research, and the people affected added as watchers.

03

Assigned to a lead

Two named owners, so nothing sat unclaimed and the pipeline stayed visible to everyone.

04

Weekly triage with the full team

Prioritization, workload, support needed, tooling, and escalations, in a standing meeting rather than a thread.

05

A package is selected, not invented

Chosen from the catalog against what the question needed, with the turnaround set at that moment.

06

Findings land on the brand and category page

Documented where the next person will look, not in the deck of the person who ran it.

07

Two weeks after launch, it comes back

Results presented to the full team for analysis and further testing, so the loop closed on the shipped thing.
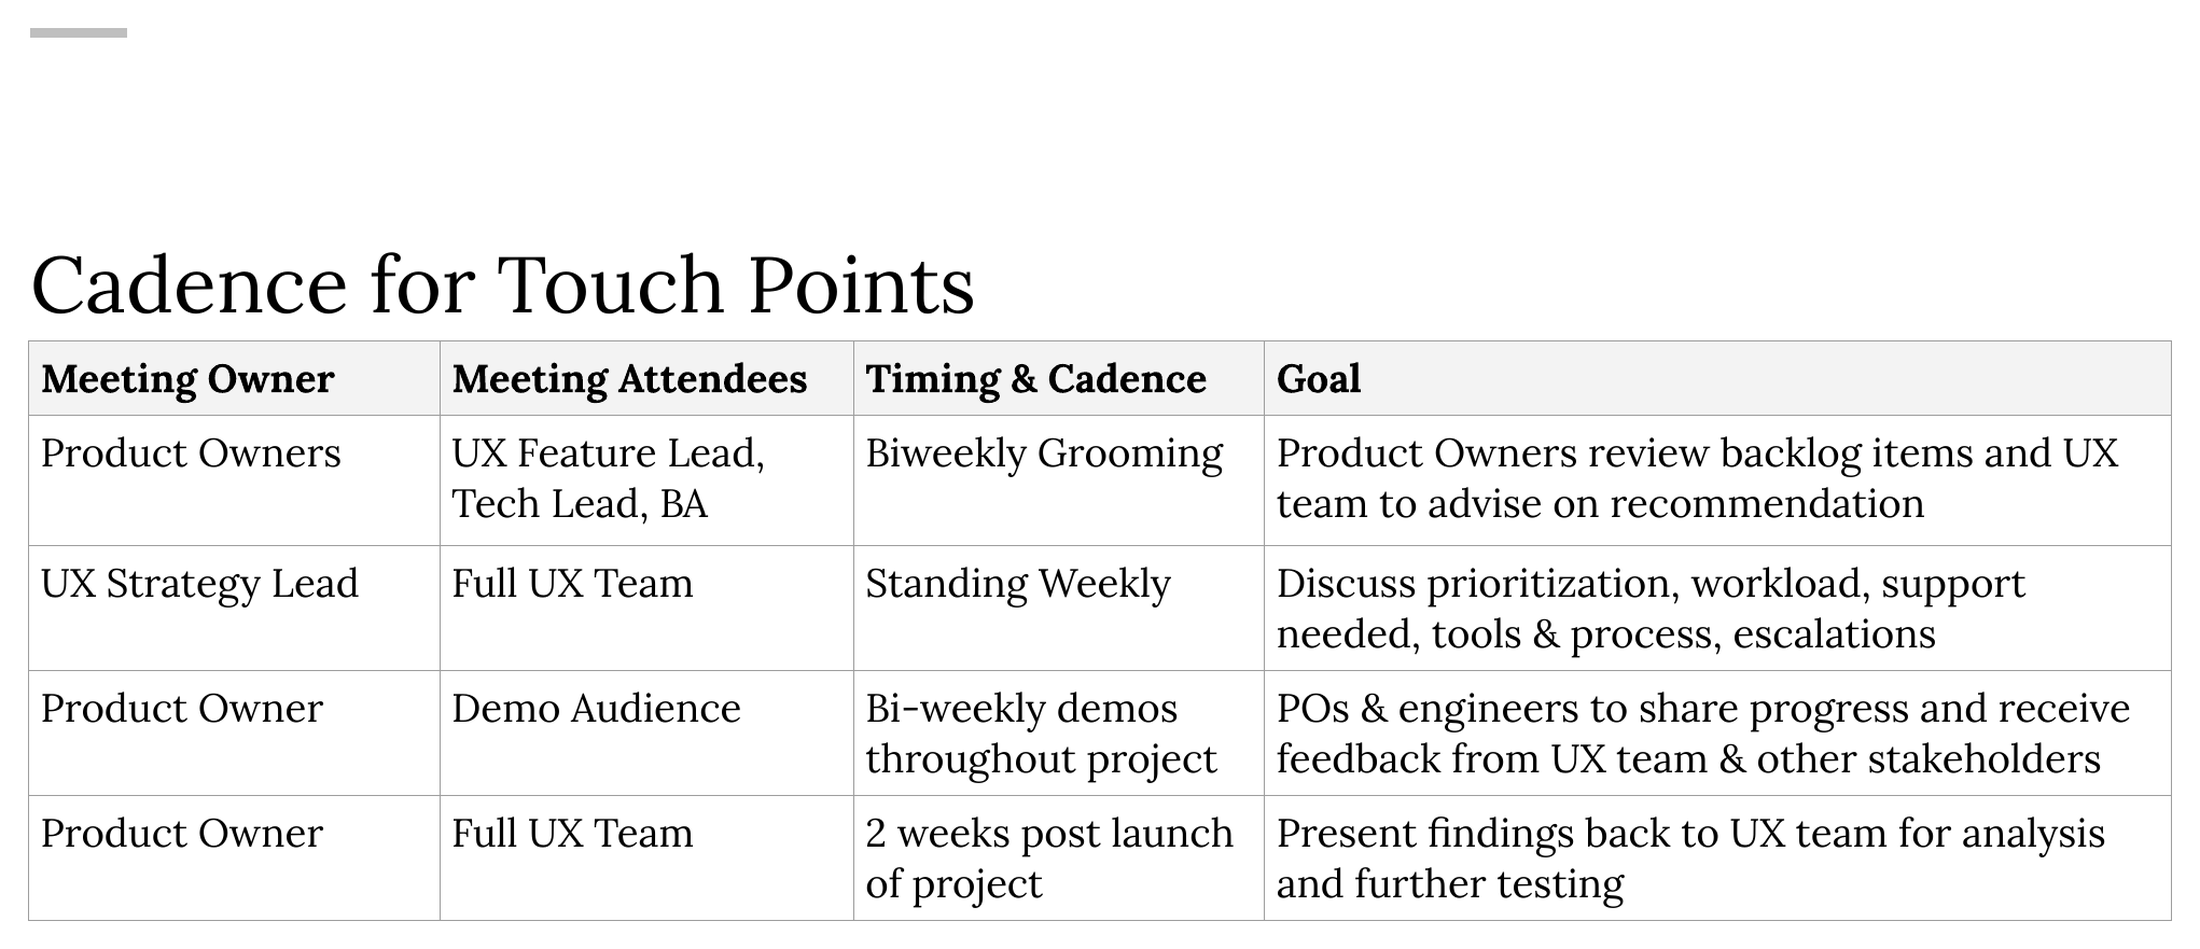
Cadence table naming four standing meetings with owner, attendees, timing, and goal
The cadence table from the founding charter. Four standing meetings, each with an owner, an audience, a rhythm, and a stated purpose, including the post-launch review the path ends on.
/ Research operations
01 / Research function

The rules that stopped us
researching the same thing twice

Nineteen brands generating studies independently produces duplicate findings and contradictory ones, with no way to tell which is which. Every researcher worked to the same short charter. Four of its five rules govern what happens before and after a study, not during it.

Read the landscape first
Past qualitative studies, A/B tests, analytics, session replay, and the industry benchmark library, all reviewed before a new study opened.
Before
Prove the study is needed
Either nothing on record covers the question, or a new hypothesis has formed since the last time it was asked.
Before
Reframe every insight as a question
Findings were rewritten as how might we before any solution was proposed, so the team worked the underlying problem instead of the first idea in the room.
During
Merge, do not stack
Findings that supported existing research were synthesized onto the same landing page, then converted into updates to the global wireframes and requirements.
If confirmed
Declare a pivot
Findings that broke existing research triggered a new hypothesis and a fresh testing plan written with the discovery team. Contradiction was a defined state with a defined next step, not an argument.
If contradicted
Sharing principles
Digestible
Data should not be legible only to the people who work in data.
Insight, not analysis
Facts are the input. The finding is the output.
High visibility
Every level, every team, invited to the same channels.
Accountable
Product, UX, design, and brand are all ambassadors of the data.
/ What I built
01 / Research function

Owning the behavioral platform,
not just using it

I was the enterprise subject matter expert for Fullstory across the portfolio: in the vendor analysis, on the Center of Excellence, and responsible for teaching every other team to run their own analysis.

Vendor analysis

Part of the evaluation behind the platform decision, and the definition of what it needed to answer for a 19-brand portfolio.

Training and education

Onboarding 101, an ELC-specific use case library, role-specific guides, and a standing office hours series I ran for brand and product teams.

Center of Excellence

Named contact to the internal and vendor Center of Excellence, where measurement defects were raised and signal definitions were governed.
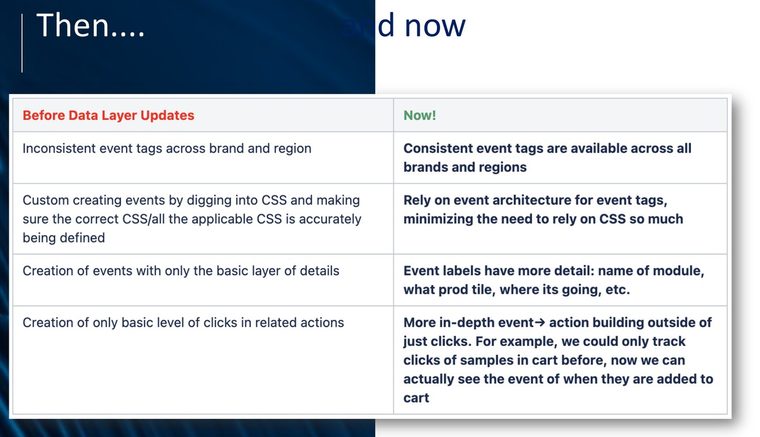
Training on the ELC data layer exposed to Fullstory
When the ELC data layer was exposed to Fullstory, I wrote and delivered the training on what changed: consistent event tags across brands and regions, richer event labels, and analysis that no longer depended on reading CSS.
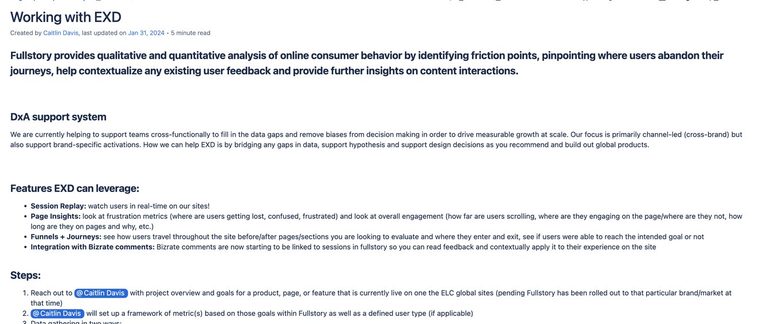
Documented service model for the Experience Design team
The service model I documented for the Experience Design team: which questions the platform could answer, how to bring one in, and what turnaround to expect.
/ Outcomes
01 / Research function

Research moved from commissioned project to standing capability.

Team built
12
From a single practitioner to two management layers across four geographies
Portfolio reach
19
Global beauty brands served by a single research and insights practice
Content lead time
−90%
Reduction in content production lead times through custom GPT workflows
What the function produced
The frameworks outlasted the org chart. Several are still the standard.